Reports & Analytics
Data-driven insights to grow your booking business
Analytics Overview
WP Booking System Pro includes a powerful analytics suite that gives you full visibility into your booking business. From real-time dashboard metrics to detailed exportable reports, you can track revenue, monitor trends, evaluate service performance, and measure staff productivity — all from your WordPress admin panel.
Booking Trends
Track growth over time
Revenue Reports
Monitor income streams
Service Insights
Find top performers
Staff Analytics
Measure productivity
Where to find analytics: The Dashboard is available at Bookings → Dashboard and detailed Reports at Bookings → Reports in your WordPress admin sidebar.
Dashboard Overview
The Dashboard (Bookings → Dashboard) provides a real-time snapshot of your booking business. It is the first screen you see when you open WP Booking System Pro, designed to surface the most important metrics at a glance.
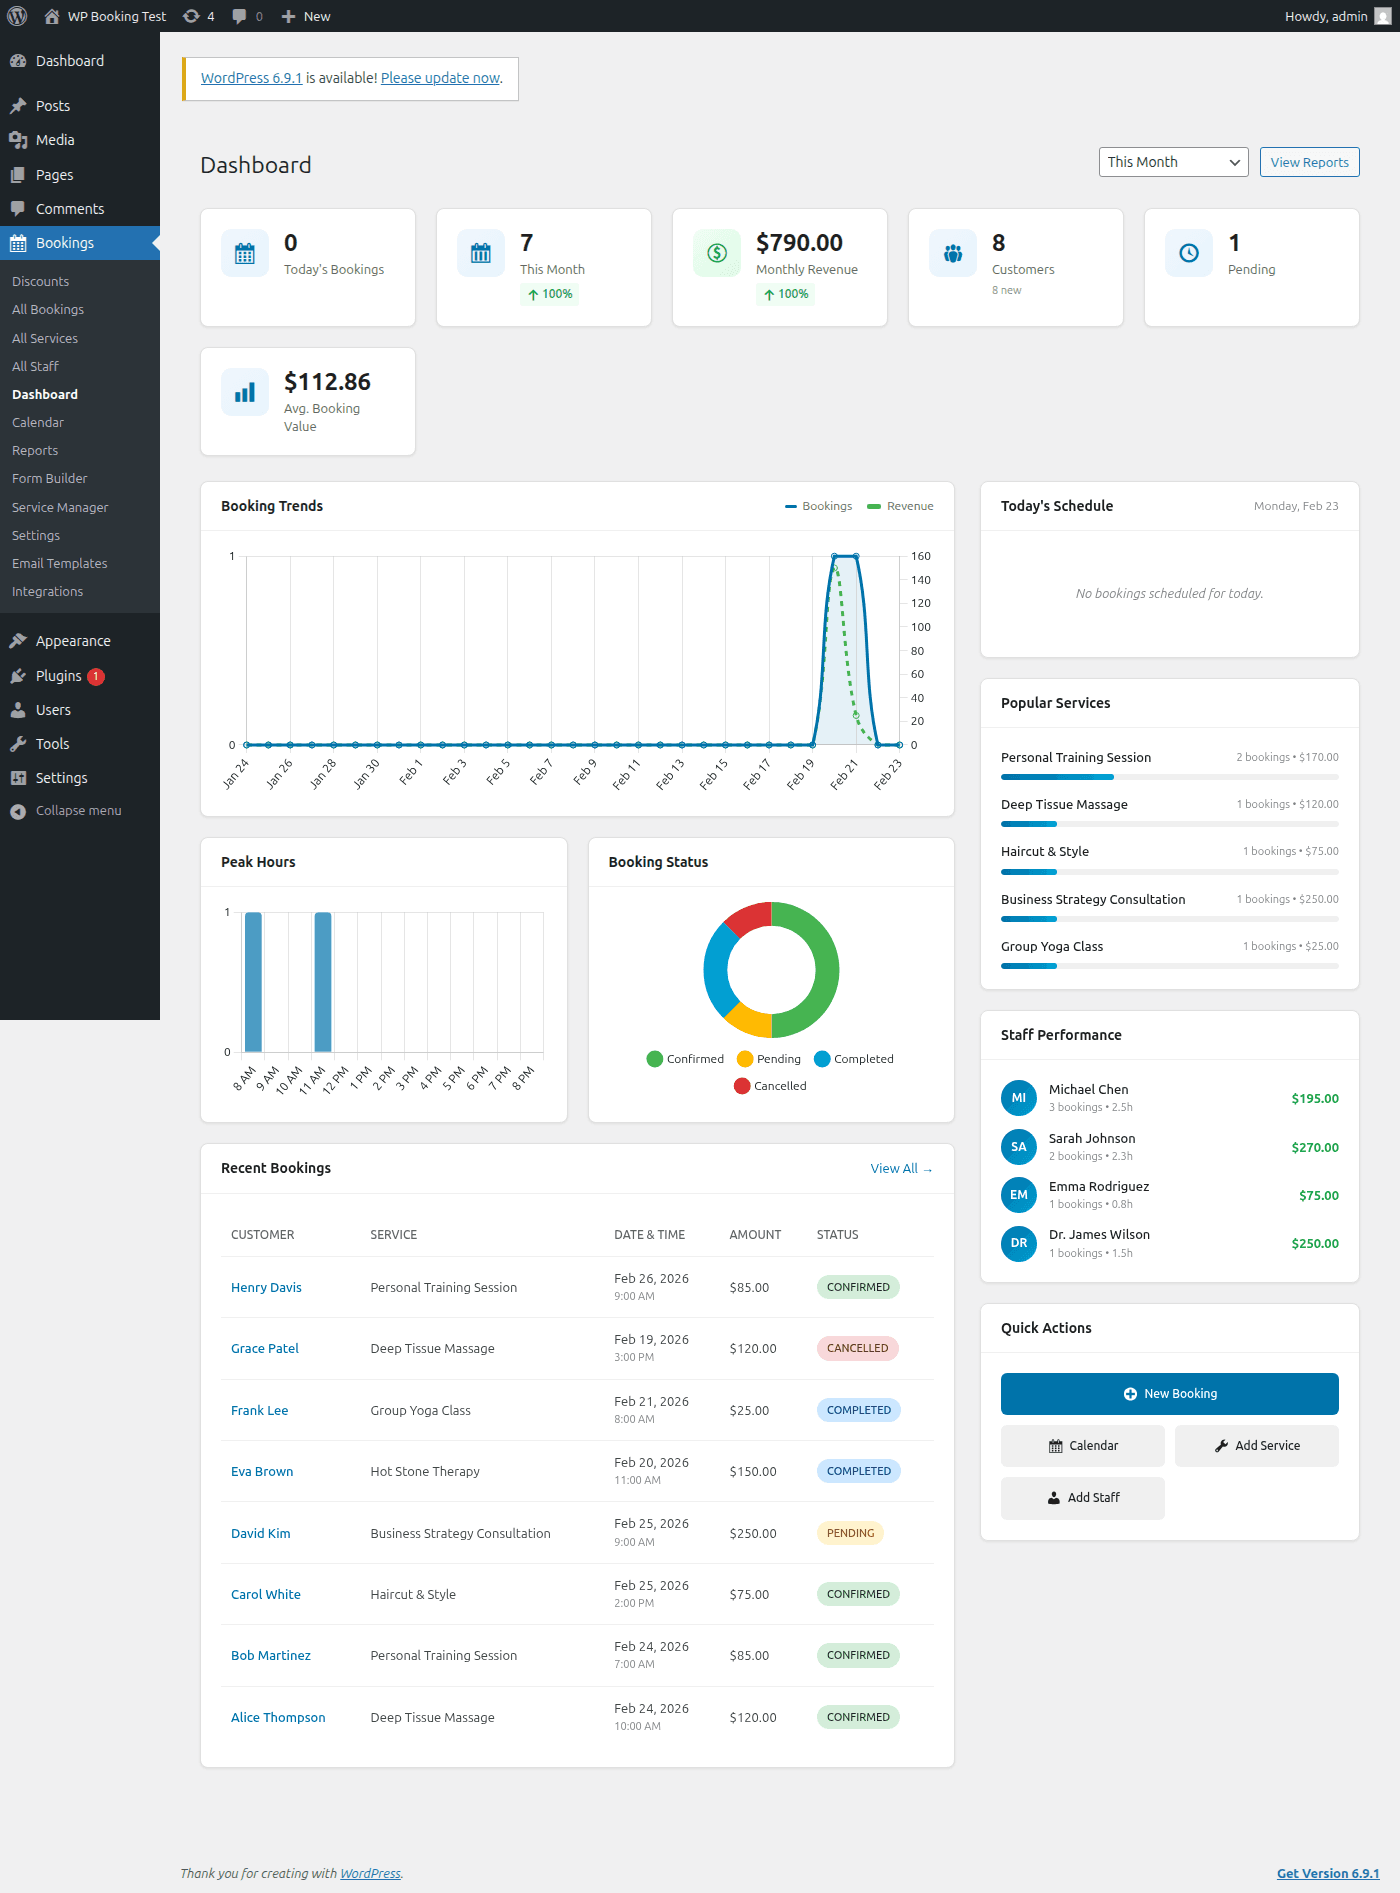
Key Metric Cards
At the top of the Dashboard, three summary cards display your most critical KPIs:
Total Bookings
The total number of bookings received within the selected date range. Includes all statuses (confirmed, pending, completed, cancelled).
Total Revenue
Cumulative revenue earned from completed and confirmed bookings. Reflects actual payments collected, not pending amounts.
Average Value
The average booking value calculated by dividing total revenue by the number of paid bookings. Helps gauge pricing effectiveness.
Booking Trends Chart
A line graph that plots your booking volume over time. Use this chart to identify seasonal patterns, growth trends, and the impact of marketing campaigns.
- Hover over any data point to see the exact count and date
- Automatically adjusts scale based on the selected date range (daily, weekly, monthly)
- Visual comparison helps spot upward or downward trends quickly
Booking Status Chart
A donut chart breaking down your bookings by status. This gives you an instant visual overview of how your bookings are distributed:
Confirmed
Approved bookings
Pending
Awaiting review
Completed
Successfully finished
Cancelled
Cancelled or rejected
Peak Hours Chart
A bar chart showing which hours of the day receive the most bookings. Use this data to:
- • Optimize staff scheduling during busy hours
- • Identify off-peak times for promotions
- • Adjust business hours based on demand
- • Plan break times during slow periods
Today's Schedule
A quick-view list of all bookings scheduled for today, including:
- • Customer name and contact info
- • Service and assigned staff member
- • Appointment time and duration
- • Current booking status
Popular Services
A ranked list of your most-booked services, showing the total number of bookings each service received. Helps you understand which offerings drive the most demand.
Tip: If a service consistently ranks low, consider adjusting its pricing, improving its description, or bundling it with popular services.
Staff Performance
A ranking of staff members by booking count. Quickly see who is handling the most appointments and how workload is distributed across your team.
Tip: Use this to balance workload, identify training needs, or reward top-performing staff members.
Recent Bookings & Quick Actions
Recent Bookings Table
The bottom of the Dashboard shows a table of your most recent bookings with columns for:
- • Customer name
- • Service booked
- • Date and time
- • Status badge (color-coded)
- • Payment amount
Click any row to open the full booking details.
Quick Actions
Shortcut buttons for common tasks, accessible directly from the Dashboard:
Reports Page
Navigate to Bookings → Reports for in-depth analytics with advanced filtering. The Reports page provides detailed breakdowns across six key categories.
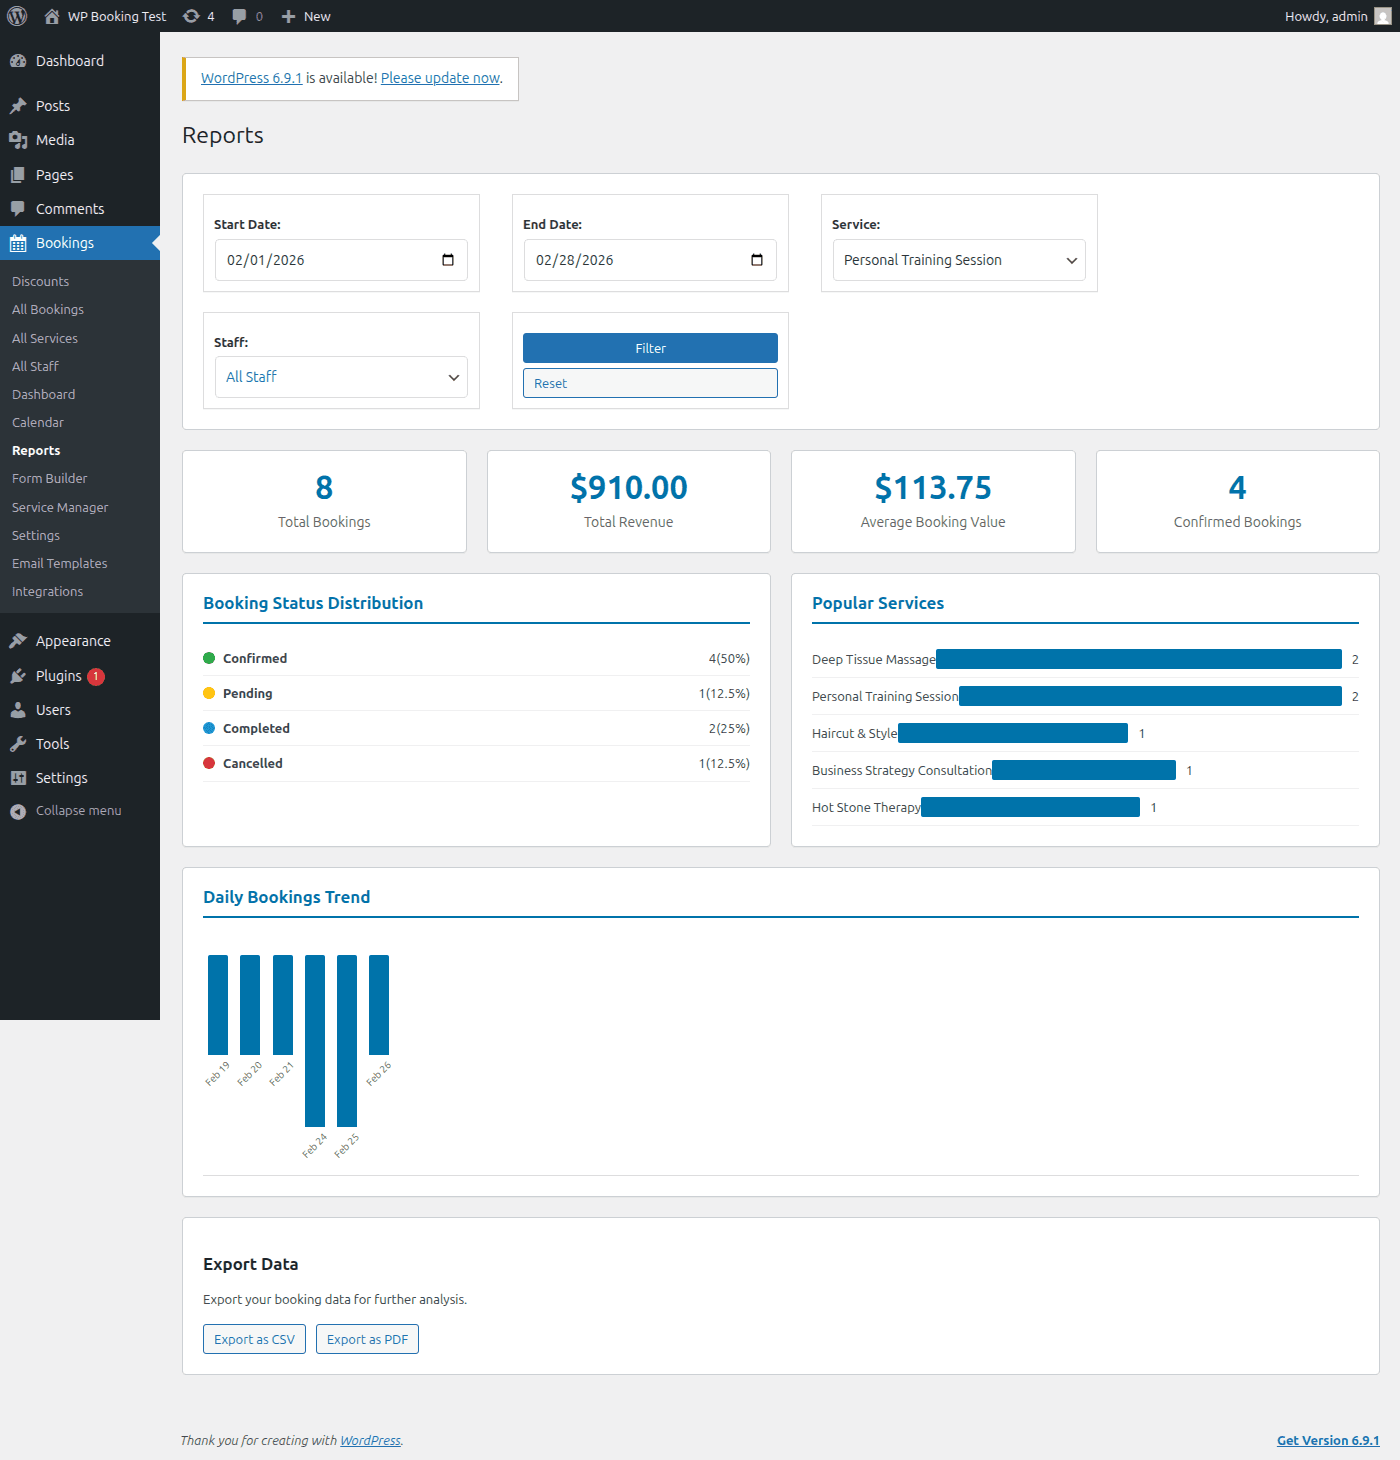
1. Booking Statistics
A comprehensive breakdown of your booking volume by status. Each metric is displayed as a card with the count and percentage of total bookings.
| Metric | Description |
|---|---|
| Total Bookings | All bookings received regardless of status |
| Confirmed | Bookings approved and awaiting their scheduled date |
| Completed | Appointments that were successfully fulfilled |
| Cancelled | Bookings cancelled by the customer or admin |
| No-Show | Customers who missed their appointment without cancelling |
Tip: A high no-show rate may indicate you need to send more reminders. Consider enabling SMS or email reminders 24 hours before appointments via Email Templates.
2. Revenue Reports
Detailed financial reporting to help you understand where your income comes from and how to maximize it.
Total Revenue
Sum of all payments collected within the selected date range. Only includes bookings with a "paid" or "completed" payment status.
Average Booking Value
Total revenue divided by the number of paid bookings. Useful for tracking pricing strategy effectiveness.
Revenue by Service
Breakdown of revenue per service offering. Identifies which services generate the most income for your business.
Revenue by Staff
Revenue attributed to each staff member based on the bookings they handled. Helpful for commission calculations.
3. Service Performance
Evaluate how each service is performing across multiple dimensions to make data-driven decisions about your offerings.
- Most Booked Services — Ranked list of services by total booking count. Shows which services customers prefer and which may need marketing attention.
- Revenue per Service — The total revenue each service has generated. A service with fewer bookings but higher revenue per booking may be more valuable than a frequently booked low-price service.
- Booking Completion Rate — The percentage of bookings that reached "completed" status for each service. Low completion rates may indicate scheduling issues or customer dissatisfaction.
Tip: Compare "Most Booked" with "Revenue per Service" to find your most profitable services. A high-volume, low-revenue service might benefit from a price increase or upsell add-ons.
4. Staff Performance
Measure individual staff member productivity and contribution to your business.
Bookings per Staff Member
Total number of bookings assigned to each staff member. Helps identify workload imbalances and ensure fair distribution.
Revenue Generated
Total revenue attributed to each staff member. Useful for performance-based compensation or commission tracking.
Completion Rates
Percentage of assigned bookings that were successfully completed. Low rates may indicate scheduling conflicts or the need for additional training.
5. Payment Reports
Track all financial transactions and reconcile payments across your integrated gateways.
| Report | Details |
|---|---|
| Payments by Method | Revenue breakdown by payment gateway (Stripe, PayPal, WooCommerce, cash). See which methods your customers prefer. |
| Refund Tracking | Total refunds issued, refund rate percentage, and individual refund details linked to their original bookings. |
| Deposit Tracking | Outstanding deposits, collected deposits, and remaining balances due. Helps manage partial payment workflows. |
Tip: Review refund tracking regularly. A refund rate above 5% may indicate issues with service quality, misleading descriptions, or scheduling problems that need attention.
6. Coupon Usage Analytics
Evaluate the effectiveness of your promotional campaigns with detailed coupon tracking.
Most Used Coupons
Ranked list of coupon codes by usage count. See which promotions resonate most with your customers and drive the most bookings.
Discount Amounts
Total discount value given per coupon code. Ensures your promotions stay within budget and helps calculate true return on marketing spend.
Tip: Cross-reference coupon usage with revenue reports. If a coupon drives high booking volume but low net revenue, consider reducing the discount percentage. Learn more about coupon management in the Coupons & Discounts guide.
Date Range Filtering
Both the Dashboard and Reports pages support flexible date range filtering, allowing you to analyze data for any time period.
How to Filter by Date Range
- Navigate to Bookings → Dashboard or Bookings → Reports
- Locate the date range selector at the top of the page
- Click a preset range button for quick filtering, or use the calendar picker for custom dates
- All charts, metrics, and tables will update automatically to reflect the selected period
Preset Date Ranges
Today
Current day only
This Week
Monday to Sunday
This Month
1st to end of month
This Year
Jan 1 to Dec 31
Custom Date Range
- Click the date picker input field to open the calendar
- Select a start date by clicking the desired day
- Select an end date to define the range
- The report data will refresh immediately with the filtered results
Compare Periods: Use custom date ranges to manually compare performance across different periods. For example, compare this month with last month to track growth, or compare the same month across different years to identify seasonal trends.
Export Options
Export your report data for use in external tools, accounting software, or presentations.
How to Export Report Data
- Navigate to Bookings → Reports
- Set the desired date range for the data you want to export
- Click the Export button located at the top-right of the reports section
- The report will be downloaded containing booking data, revenue figures, and performance metrics for the selected period
Tip: Schedule monthly exports to maintain an offline archive of your business analytics. This is especially useful for tax reporting, sharing performance data with stakeholders, or importing into accounting software like QuickBooks or Xero.
Analytics Best Practices
Daily Check-ins
- Review today's schedule on the Dashboard
- Check for pending bookings that need confirmation
- Monitor recent booking activity for anomalies
Weekly & Monthly Reviews
- Compare weekly booking trends for growth patterns
- Review staff performance and adjust schedules
- Export monthly reports for financial records
- Evaluate coupon performance and adjust promotions
You're Ready to Analyze!
You now have a complete understanding of the analytics tools available in WP Booking System Pro. Start using the Dashboard for daily monitoring and the Reports page for deeper business analysis.
Next: Connect Third-Party Integrations